


Formation pressure conditions and injection efficiency are becoming material inputs in how Permian water disposal assets get valued and underwritten. B3 Insight’s 1Q 2026 Permian Basin Produced Water Operator Analysis tracks both across the seven largest named midstream operators in the basin, with data running from January 2024 through March 2026. The findings point to a market where geography, infrastructure strategy, and capital discipline are producing meaningfully different outcomes across operators that, at the headline level, look like they are competing in the same market.
The metrics that determine operational viability
Permitted capacity and volume utilization are the starting point for most disposal market assessments. Three additional metrics tracked by B3 Insight across every active operator position in the basin provide the picture: bottomhole pressure, the spread between injection and resting formation pressure, and injection efficiency measured in barrels disposed per PSI of applied wellhead injection pressure.
In Loving County, the basin’s largest disposal market at 3.1 million BPD, a $0.75 per barrel injection fee translates to more than $2.3 million in gross daily disposal revenue. Yet the underlying metrics tell a materially different story than the headline numbers. The pressure spread has widened significantly over two years. Formation pressure is rising, and the cost consequences are already visible in operator-level efficiency data. One major operator now requires nearly twice the wellhead pressure to move the same volume it was disposing two years ago. The market is shrinking.
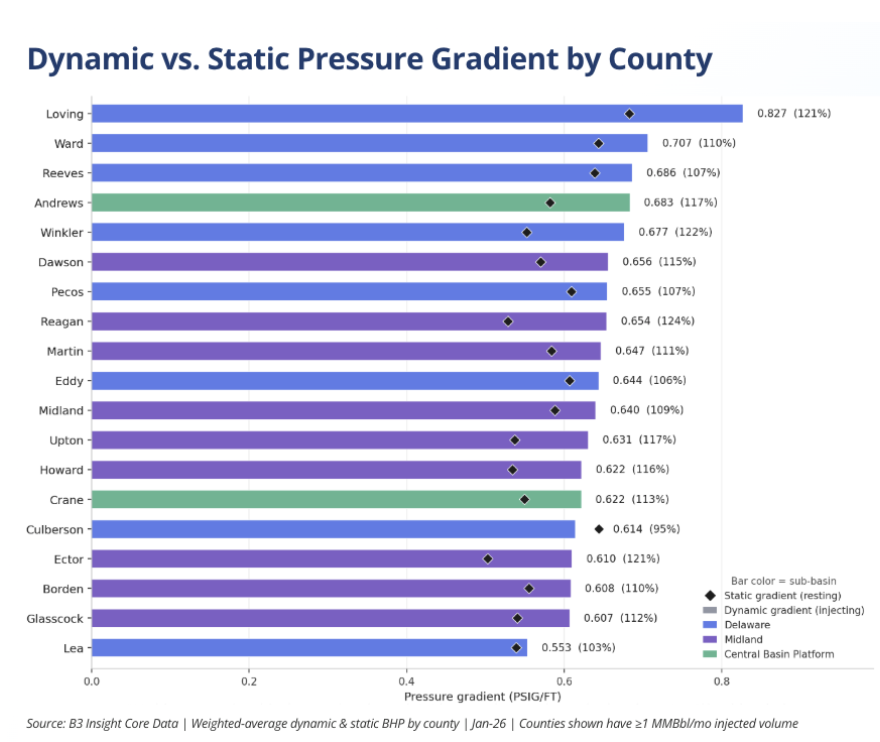
This chart measures how much of the available pore space has already been occupied in each county—the underground equivalent of squeezing a damp sponge. The diamond shows how saturated the formation already is, the bar shows the injection pressure being applied, and the percentage indicates how much of that pressure is working against water already in the rock.
How the operator field is splitting
The 1Q 2026 data shows three distinct trajectories across the seven tracked operators.
The largest by volume are concentrated in the Delaware Basin’s highest-pressure counties and posting two-year growth rates between 5% and 23%. Their permit pipelines are substantial, but the data behind those filings points to capital being deployed to relieve pressure conditions already building in the existing well stock as much as to capture new volume. That distinction matters for how forward CAPEX gets modeled on these assets.
A second group is growing faster on a percentage basis, operating in lower-pressure Midland Basin terrain with utilization rates and headroom scores that reflect genuine capacity to absorb additional volume. The combination of strong growth, low utilization, and formation pressure well below stress thresholds represents the strongest risk-adjusted positioning in the current dataset.
Two operators are in outright volume decline, with a combined permit pipeline that points more toward consolidation.
What the permit pipeline signals
The 264 approved but not yet operational disposal wells across these seven operators are one of the more transparent forward indicators available in this market. Some of those permits represent deliberate new market entry, positioned ahead of anticipated tightening in higher-pressure areas of the basin. Others are relief capacity for pressure conditions already underway in the existing well stock. Reading that distinction correctly is where the timing edge sits for capital allocation decisions. Assuming an average cost of $5 million to drill and equip each injection well, developing this additional disposal capacity would require more than $1.3 billion in capital investment.
Implications for investors and E&P operators
For investors and lenders, asset valuations built on permitted capacity overstate practical disposal capacity in high-pressure areas of the basin. The top-tier operators’ permit pipelines represent committed capital to address conditions already in place, and modeling them as discretionary expansion spend will overstate operational flexibility and understate near-term CAPEX requirements.
For E&P operators, county-level conditions vary enough that disposal contract positioning carries direct cost implications. Where your disposal volume sits in the basin, and with which operator, is a more consequential input to production economics than basin-level figures suggest.
The full report covers disposal markets at the county level, with complete operator profiles, formation pressure trend data from January 2024 through March 2026, normalized headroom scores, and permit pipeline analysis for all seven tracked operators.
Download the Permian Water Midstream Intelligence Report Summary