Water handling is now a structural cost driver, and it’s showing up in valuations. What 2H 2025 basin data tells us about SWD capacity, pore pressure, and long-run development economics.
Permian water economics have crossed a threshold that commodity-driven models have yet to capture. Disposal capacity on paper looks adequate; disposal capacity in the actual rock formations increasingly does not. For anyone underwriting Permian assets or midstream cash flows, the spread between those two numbers is becoming a material valuation input.
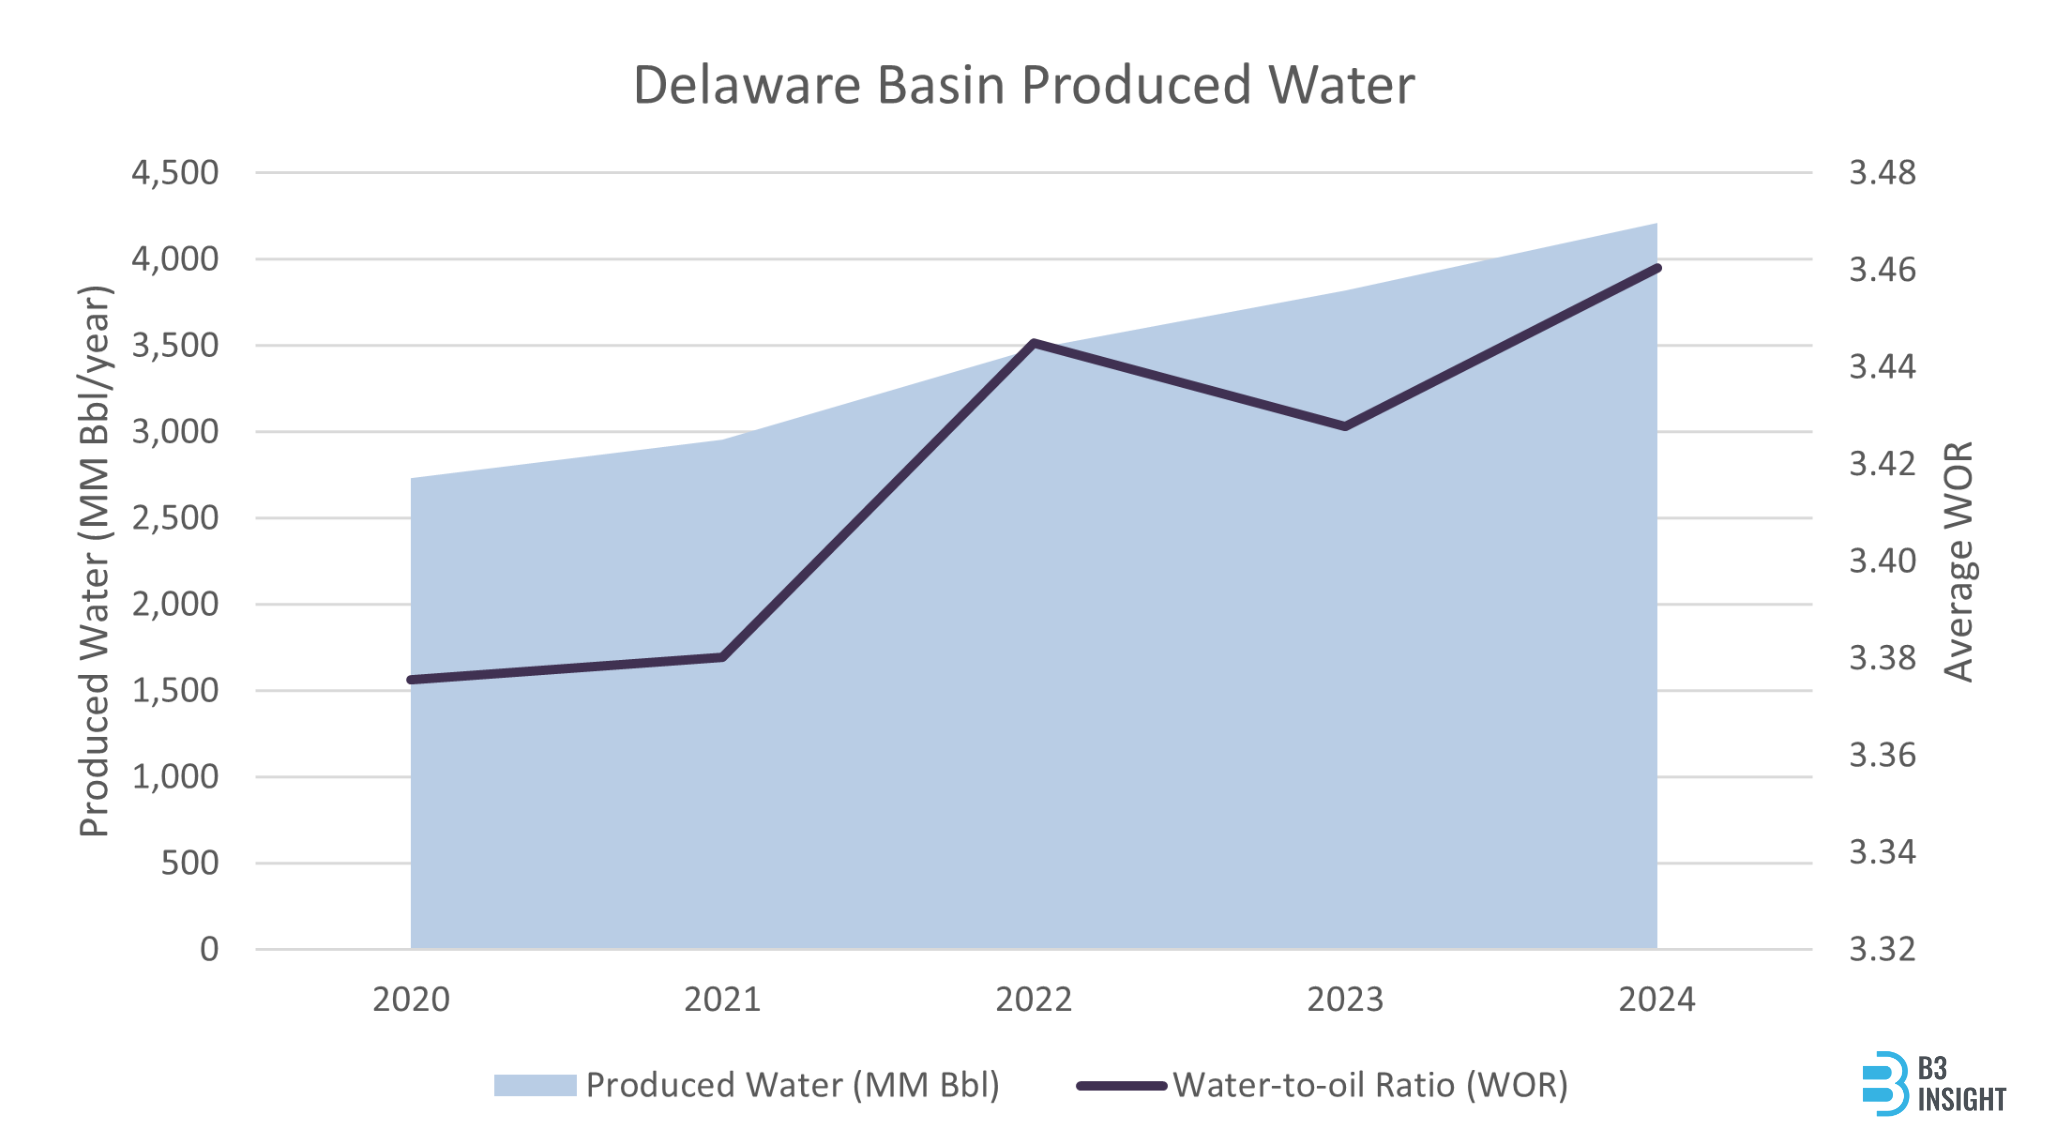
Produced water has been a growing a cost driver for the better part of a decade. Water-to-oil ratios (WOR) have climbed steadily, saltwater disposal (SWD) infrastructure is absorbing more than it was designed for, and water handling has moved from a quiet lease operating expense line item to a meaningful input in type-curve economics.
None of this is new to operators running Permian assets. What has changed is that basin-wide data is now granular enough to quantify it with precision. B3 Insight’s 2H 2025 Permian Water Market Trends and Forecast Report pulls actuals through Q4 2025 and forecasts to 2036, and it provides the clearest view we’ve seen of where this market is heading.
Produced water is a compounding cost, not a cyclical one.
In 2025, every barrel of Permian oil came with roughly four barrels of produced water basin-wide. That ratio continues to climb as the basin ages, water cuts rise on existing wells, and operators develop tighter spacing in wetter zones and benches across the Wolfcamp and Bone Spring.
Most long-range models treat water handling as a commodity-linked input. The mechanics suggest otherwise. drilling & completions spend is discretionary — when West Texas Intermediate (WTI) softens, rigs drop and capex flexes down within a quarter or two. Produced water does not work that way. Once a well is producing, the reservoir dictates how much water comes with the oil, and that volume generally grows over the life of the well rather than shrinks. Gathering, transport, and disposal obligations recur in every price deck, on a back-weighted curve, against a growing base of producing wells and water-handling infrastructure already operating across the basin.
Basin-aggregate growth can slow when activity drops, but the existing obligation does not moderate with the strip. Handling costs do have variable components — diesel, power, recycling economics — but the underlying volume is set by reservoir physics, not by WTI. For models with a long enough horizon, water handling is closer to a fixed obligation tied to the installed base than to a commodity-linked operating cost, and modelling should reflect that.
Permitted capacity is not deliverable capacity.
As shallow disposal intervals — particularly the Delaware Mountain Group and parts of the San Andres — mature, reservoir pressure builds, injectivity falls off, and wells run well below permitted rates. Some are being shut in or stepped down by the Railroad Commission of Texas and New Mexico Oil Conservation Division on seismicity grounds. The gap between authorized capacity and what can actually be put away is widening across several high-activity areas.
The market tends to price permitted capacity. Deliverable capacity is the number that matters.
Pressure-driven cost events are step-changes, not gradients.
When disposal intervals approach their operational ceiling, costs do not drift up linearly — they jump. Trucking picks up because gathering systems cannot move barrels to where capacity still exists. Curtailments hit. Disposal contracts get repriced or renegotiated mid-term. Operators with firm capacity look very different from those on interruptible.
In parts of the Delaware — Reeves and Loving especially — injection volumes already exceed locally produced water, meaning barrels are being piped or railed in from elsewhere to fill SWDs that still have headroom. That concentrates pressure and seismicity risk into a narrower geography, which is precisely where regulators are focused. These signals appear in water system data well before they reach 10-Qs or guidance, which is where the timing edge sits for financial market participants.
Infrastructure configuration is the new differentiator.
When local disposal tightens, exposure is not uniform. Operators with diversified SWD networks, access to multiple disposal zones (deep Ellenburger optionality, for example), and integrated recycling systems retain real flexibility. Operators concentrated in high-pressure corridors with one or two SWD options absorb the cost.
Recycling now covers the majority of completion water demand basin-wide, which is a genuine shift from five years ago. It is worth being precise about what that does and does not solve: recycling reuses frac water, but it does not make produced water disappear. The back-end barrels still need a destination, and disposal is deferred. Infrastructure configuration is becoming a real differentiator between durable assets and exposed ones, and it is not always visible at the operator-reporting level.
Water spend is a valuation input now.
Water handling is a persistent capex and opex line with direct implications for breakevens, midstream cash flows, and asset longevity. Those costs are showing up in margins and midstream contracts in ways that commodity-driven models do not capture cleanly.
For active market participants, the relevant signal is in near-term cost events. For long-horizon underwriters, it is in the durability of the cash flows — and in the downside cases that water constraints can drive, which are not small on a ten-year hold. The 2H 2025 report breaks this down at the basin and sub-basin level, with regional capacity fill-up analysis and cost trajectories through 2036.