

Most coverage of the Haynesville focuses on gas fundamentals such as completions activity, Henry Hub pricing, and LNG offtake commitments along the Gulf Coast. These indicators are useful, and they point to a basin with sustained development activity through the rest of this decade.
Water is a second, related market within the same basin, with its own volumes, its own regional structure, and its own multi-year trajectory. It is also where the Haynesville is most unusual. At roughly 775,000 to 856,000 barrels per horizontal completion, per-well frac water intensity here runs 40 to 70% above Permian averages, the highest of any major U.S. shale play. B3 Insight’s new Haynesville Water Market Trends and Forecast Report Summary, built on the same OilfieldH2O data our subscribers use every day, introduces that market and the dynamics shaping it.
What LNG Demand Does, and Does Not, Do to Basin Activity
The Haynesville sits near the Gulf Coast LNG export corridor, where long-dated offtake contracts underpin multi-year development programs. But that export demand has not shown up as higher domestic gas prices, because the binding constraint is U.S. liquefaction capacity, not gas supply. With no spare capacity to move additional gas to international buyers, the Henry Hub price has stayed at levels high enough to sustain activity but not to justify expanding it. Completions recovered to 452 wells in 2025, well short of the 2022 peak of 628. Frac water demand tracks completions directly, so the water demand trajectory follows new export capacity coming online rather than today’s gas price.
Produced Water and Frac Water Demand as Two Distinct Markets
The Haynesville produced roughly 1.28 million barrels of water per day in 2025 and consumed roughly 1.04 million barrels per day for completions. The volumes are comparable, but the streams are largely separate: injection and disposal takes produced water, while completions in the Haynesville draw predominantly on fresh groundwater and surface water. Recycled produced water meets only an estimated 5 to 10% of completion demand today. Recycling is the only bridge between the two streams, and it is a narrow one.
Frac water demand has followed its own pattern across the last five years, moving in step with completions activity in each state.
Disposal Market Structure Differs Between Texas and Louisiana
Frac water is one stream. Produced water is the other, and it is where the two states diverge most sharply. Texas combines a dominant commercial disposal segment with an established water midstream presence, both built to absorb outside volume at scale. Water management in Louisiana is overwhelmingly E&P captive: nine of its top ten disposal operators are producers disposing their own water, and no integrated water midstream operator appears in the top tier.
That structural difference shows up clearly in how injection volume and well count break down between the two states.
Louisiana has consistently delivered the larger share of frac water volume across this period, and Louisiana wells now consume roughly 13% more water per completion than Texas wells. The report attributes the gap to lateral length, completion design, and whether the target is the Haynesville or the Bossier.
Disposal Market Structure Differs Between Texas and Louisiana
Frac water is one stream. Produced water is the other, and it is where the two states diverge most sharply. Texas combines a dominant commercial disposal segment with an established water midstream presence, both built to absorb outside volume at scale. Louisiana is overwhelmingly E&P captive: nine of its top ten disposal operators are producers disposing their own water, and no integrated water midstream operator appears in the top tier.
That structural difference shows up clearly in how injection volume and well count break down between the two states.
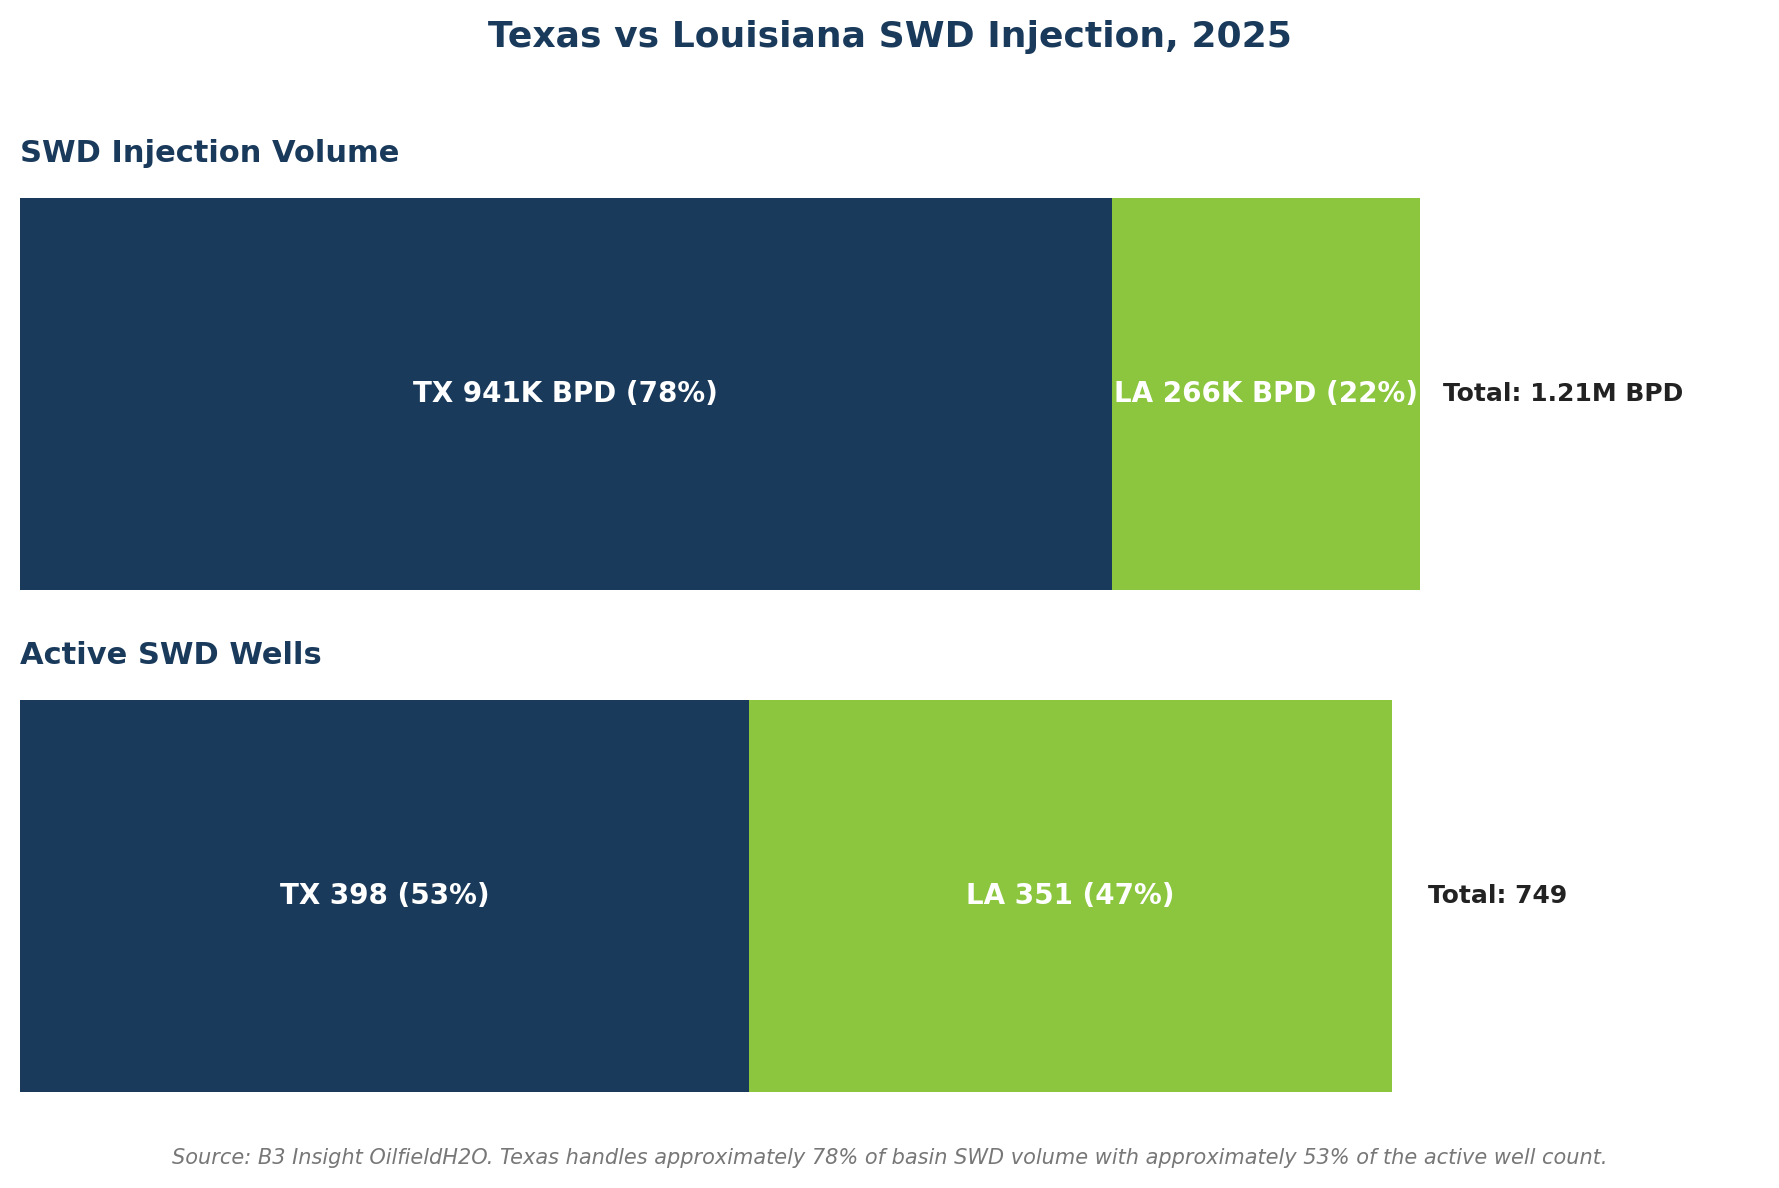
Texas handles a larger share of basin disposal volume relative to its share of active wells, reflecting a market built to absorb outside volume at scale. The clearest consequence shows up at the state line. Roughly 187,000 barrels per day of Louisiana-produced water is trucked and piped into Texas disposal wells, a volume equal to about 70% of everything Louisiana disposes of in state. The summary walks through the volumes and the regulatory and infrastructure factors behind that flow.
A Ten-Year Outlook for Water Infrastructure
Across the forecast period, produced water is projected to grow roughly 52% by 2036 while SWD injection volumes grow about 20%, opening a gap near 450,000 barrels per day. The forecast has recycled produced water meeting close to 40% of frac demand by 2036, against an estimated 5 to 10% today.
The Permian is the reference case for a disposal-constrained basin. B3’s Permian report documents rising shallow-formation pressures, designated seismic response areas, and permitting activity that effectively replaces lost capacity rather than adding net new capacity, alongside a shift toward long-haul and out-of-basin disposal. Permian recycling volumes have grown in an effort to offset those constraints and is forecast to meet roughly 95% of Permian frac demand by 2036. Permian disposal volumes still rise over the same period, because produced water there is far larger than completions can absorb.
The Haynesville’s two streams are close enough in size that recycled water could offset disposal directly. At 10% recycling penetration, roughly 100,000 barrels per day of disposal is avoided, equal to about 38% of Louisiana’s total SWD injection. The basin already produces more water than its completions require, so what limits recycling is not the supply of produced water. It is the economics of treating that water and building the gathering, and distribution infrastructure systems that move it from producing wells to completion sites.
Haynesville injection pressures and volumes are not evenly distributed. A few Louisiana parishes already operate close to their permitted injection pressure limits, leaving little headroom for additional volume. That is one of three conditions the report tracks in assessing whether recycling penetration rises from today’s estimated 5 to 10%, alongside freshwater sourcing costs and operator willingness to fund the gathering and pipeline infrastructure that moves produced water to completion sites.
Why This Is Worth a Closer Look
Four things sit in the same basin: the highest per-well frac water intensity in U.S. shale, two largely separate water streams, sharply different disposal models on either side of the state line, and a widening forecast gap between produced water and injection. The report summary puts numbers to each of them.
Learn More
The full report summary covers each of these dynamics in more depth, including basin volumes, operator-level disposal market share, cross-border water movement, and what the ten-year forecast means for anyone with exposure to the Haynesville.
Download the Haynesville Water Market Trends and Forecast Report Summary. Every figure in it comes from OilfieldH2O, B3’s water intelligence platform, and we are glad to walk you through the underlying data live. Contact the B3 Insight team to schedule a platform walkthrough or to request the complete report and forecast model.