Reading Time: 5 minutes
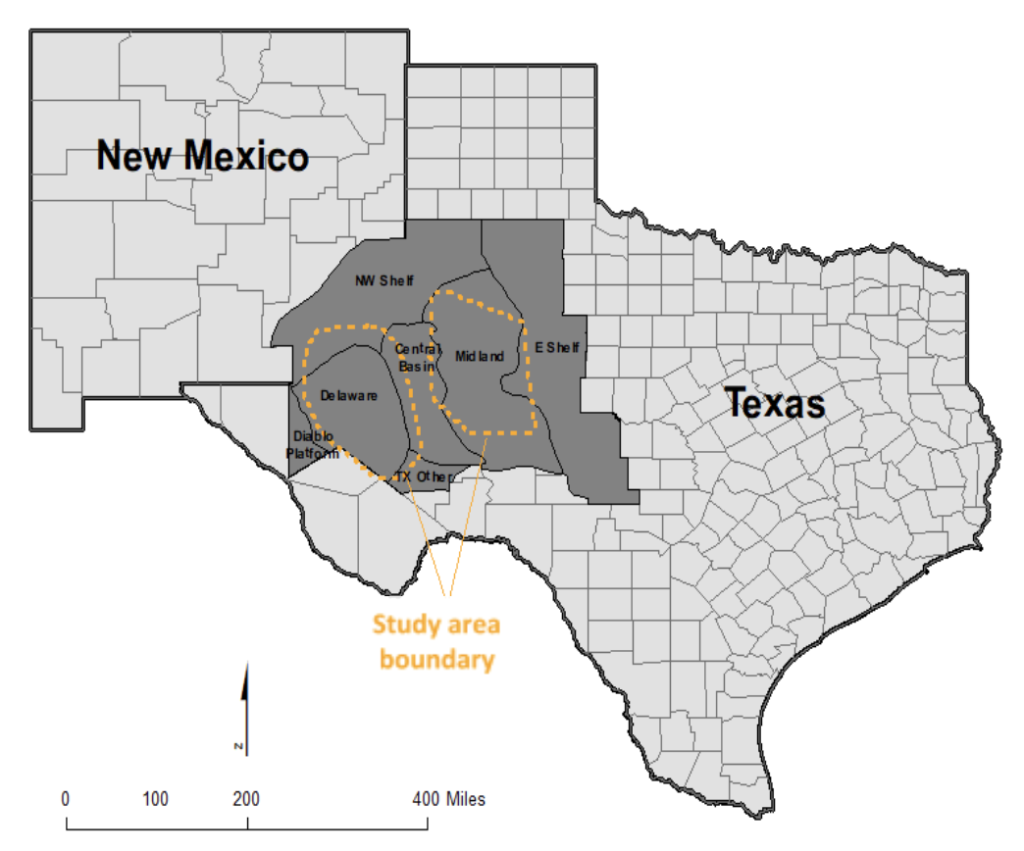
To evaluate the effect of subsurface water disposal on the spatial and temporal reservoir pressure distribution in the Permian Basin, B3 and Enverus developed regional subsurface fluid flow models of the two principal shallow disposal zones: the Delaware Mountain Group (DMG), located primarily within the Delaware Basin, and the San Andres (SA) formation, located primarily within Midland Basin (Figure 1).
 Figure 1. Delaware Mountain Group (yellow dashes, left) and San Andres (yellow dashes, right) model area boundaries. Source: Enverus.
The current study covers approximately 10,000 mi2 of the Delaware Basin and 11,000 mi2 of the Midland Basin. Structure maps of each shallow disposal formation were provided by Enverus, with the lateral extent of the mapped formations roughly conformable to the Delaware Basin and Midland Basin boundaries; depth to formation top for both the DMG and SA is shown below in Figure 2. Rock- and fluid-property data was obtained from published literature and operator-submitted regulatory reports.
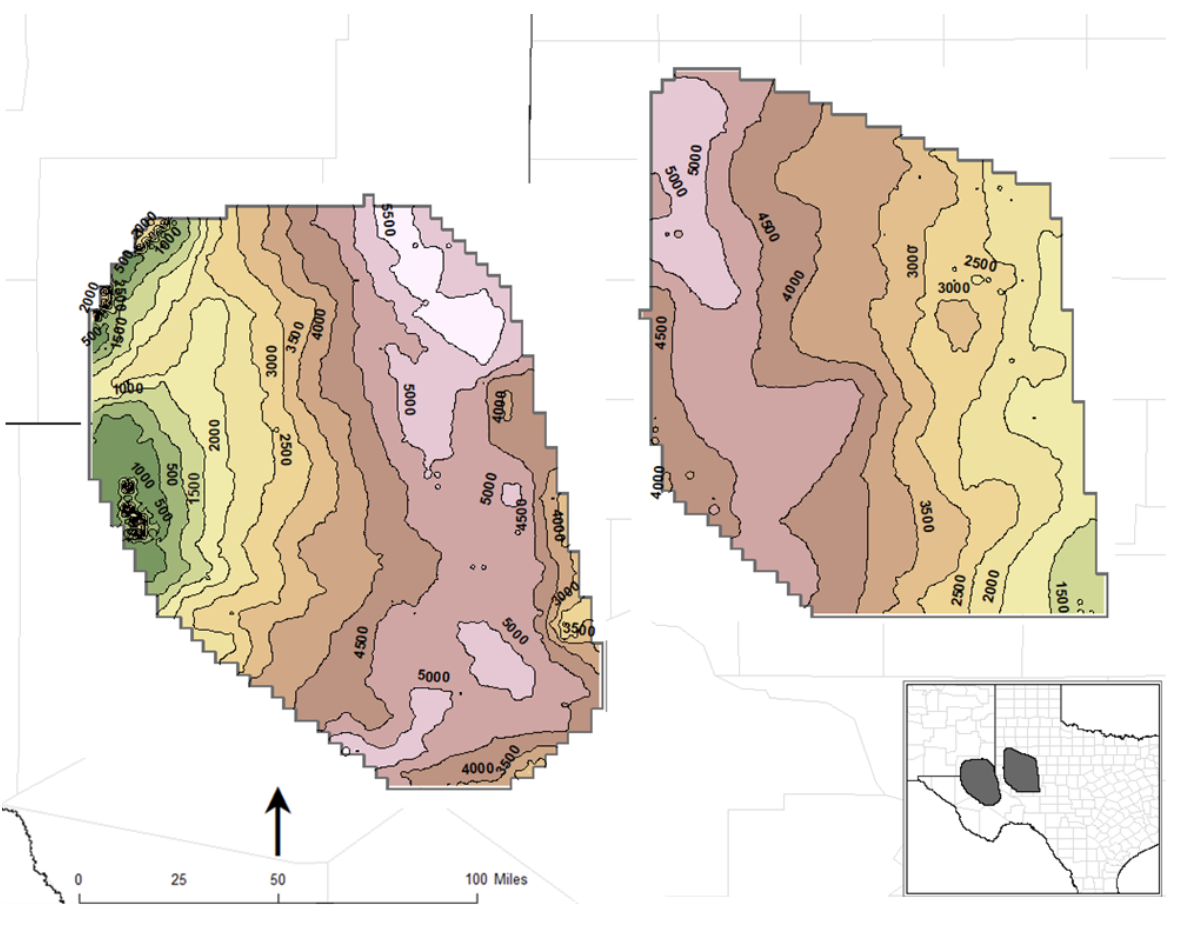 Figure 2. Depth to top of formation for the DMG and SA. Contours in feet from mean sea level. Source: Enverus.
The location of disposal wells with a completed interval intersecting the DMG and SA is depicted in Figure 3. As the top and bottom of a completed well interval can extend beyond a single geologic horizon, injection volumes were apportioned based on the fraction of the interval within the DMG and SA units.
Figure 2. Depth to top of formation for the DMG and SA. Contours in feet from mean sea level. Source: Enverus.
The location of disposal wells with a completed interval intersecting the DMG and SA is depicted in Figure 3. As the top and bottom of a completed well interval can extend beyond a single geologic horizon, injection volumes were apportioned based on the fraction of the interval within the DMG and SA units.
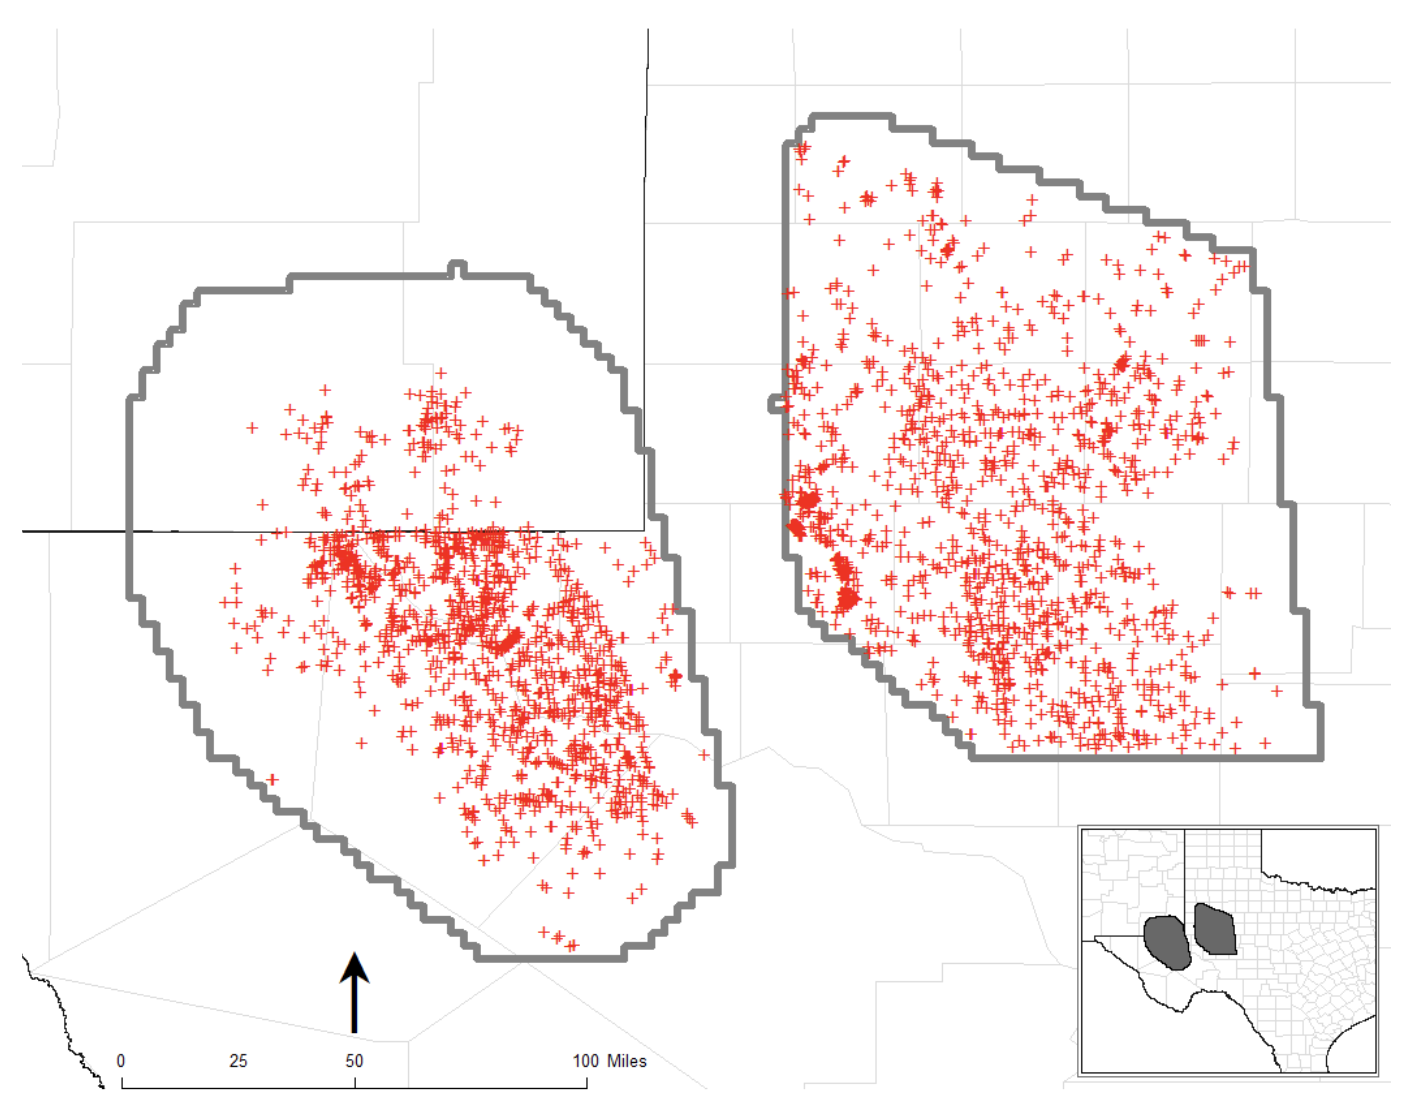 Figure 3. Location of disposal wells actively injecting into DMG and SA from 1983 to 2017. Source: B3 Insight and TX & NM state data.
The distribution of cumulative injection volume for 1983-2017 into the DMG and SA formations, aggregated using the Texas Water Development Board (TWDB) water well grid system, is shown in Figure 4, with ovals indicating areas of highest injection. High cumulative volumes in the DMG are generally located in the center of the Texas-side of the Delaware Basin; in the SA, high cumulative injection volumes are more concentrated in the southwest corner of the Midland Basin.
Figure 3. Location of disposal wells actively injecting into DMG and SA from 1983 to 2017. Source: B3 Insight and TX & NM state data.
The distribution of cumulative injection volume for 1983-2017 into the DMG and SA formations, aggregated using the Texas Water Development Board (TWDB) water well grid system, is shown in Figure 4, with ovals indicating areas of highest injection. High cumulative volumes in the DMG are generally located in the center of the Texas-side of the Delaware Basin; in the SA, high cumulative injection volumes are more concentrated in the southwest corner of the Midland Basin.
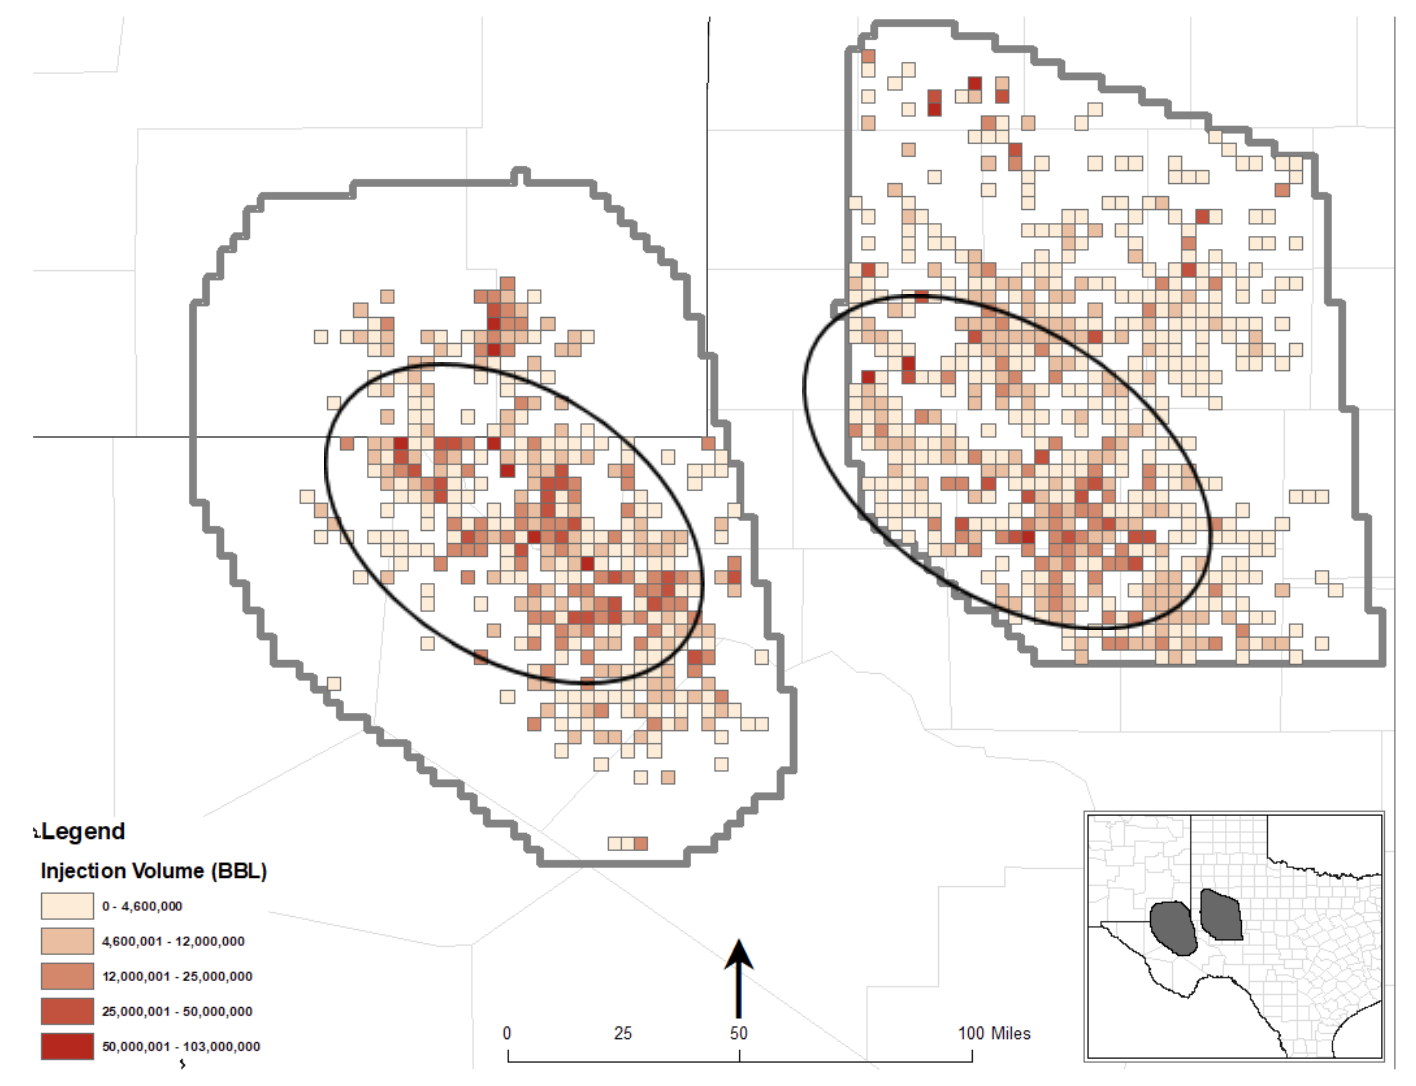 Figure 4. Cumulative injection volume into DMG and SA from 1983 to 2017. Source: B3 Insight and TX & NM state data.
Figure 2. Depth to top of formation for the DMG and SA. Contours in feet from mean sea level. Source: Enverus.
The location of disposal wells with a completed interval intersecting the DMG and SA is depicted in Figure 3. As the top and bottom of a completed well interval can extend beyond a single geologic horizon, injection volumes were apportioned based on the fraction of the interval within the DMG and SA units.