kbrady
The United States’ top two oil producing basins seem worlds apart. At the time of writing, an April blizzard was howling through Williston, North Dakota, the metropolitan hub for much of the Bakken Shale. Meanwhile, the high temperature estimates were already well into the sweltering 90s for Midland, Texas, one of the largest cities in the Permian Basin. The Permian Basin continues to reign supreme and has firmly established Texas (TX) and New Mexico (NM) as the top two oil producers in the US, but production from the Williston Basin has spurred North Dakota (ND) into a close third.1
B3 recently launched our new OilfieldH2O Platform for ND water data. Although TX, NM, and ND seem like apples and oranges, shale production in both regions is accompanied by large volumes of water that must be managed. Water production from the Bakken is not as prolific as from the Permian, but the management strategy is similar. The majority of water produced from Bakken wells is transported to disposal wells to be injected in geologic formations deep beneath the ground surface. The data detailing this journey is collected and organized by the ND Industrial Commission Oil and Gas Division, but unlike the TX and NM agencies, this data is not freely available.
Why North Dakota?
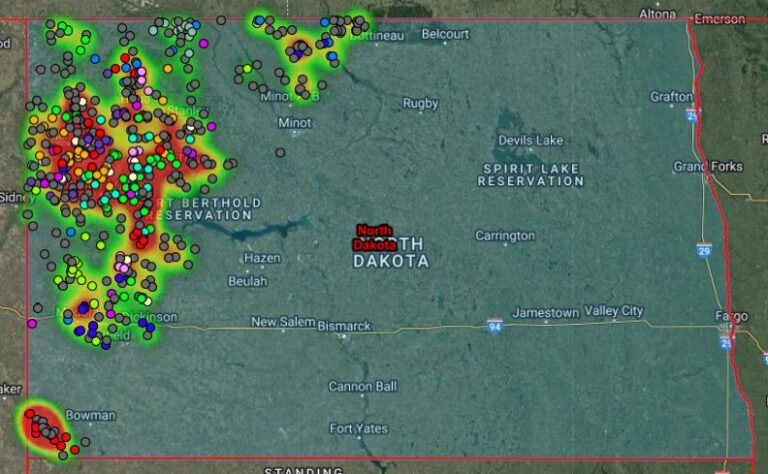
The increasing importance of Bakken production highlights the need to optimize water management decisions by leveraging data and analytics. The quality of the collected water data in ND is excellent and captures the nuances of water management in the Bakken. Operators are required to submit information on where water is produced, disposed of, how it is transported from site to site, injection pressure, which well produced the water, the operator names of producers and gatherers, and other granular details. This information has two crucial barriers to widespread use: 1) it’s not free and publicly available, and 2) it’s difficult to understand because it lives in disparate text files.
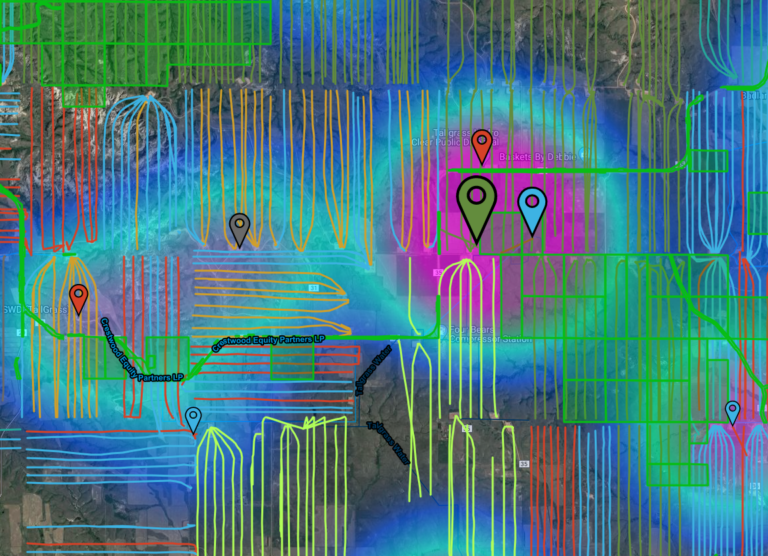
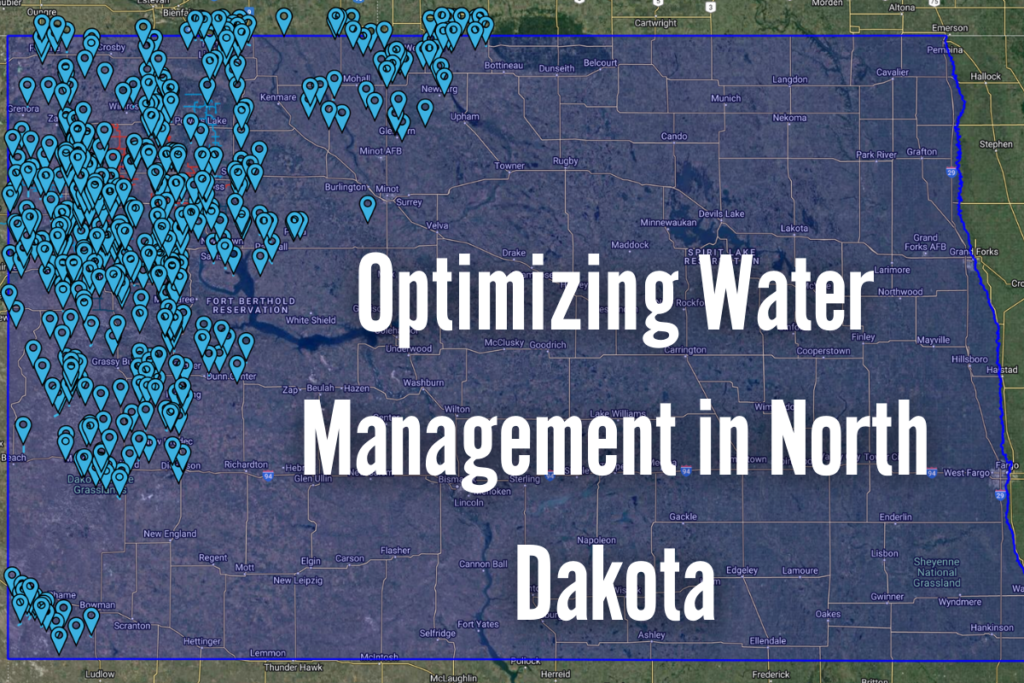
Working in a development partnership with new and existing clients, B3 developed a ND version of our powerful geospatial platform so producers can finally visualize the story of water in the Bakken. Water data from the Bakken is no longer just a script, with operators struggling to see the big picture. Water management is a logistics game, and the ability to visualize infrastructure, distances, elevation, and production areas is crucial to making informed decisions. This is especially true in ND where infrastructure and resources are limited, distances are vast, and conditions are extreme, making water management decisions incredibly complex.
sEE THE fOREST, NOT JUST THE TREES
Visualization of data can enable better water management decisions that optimize operations, costs, downtime, resource allocation, and foster enhanced water stewardship and sustainability practices. The ongoing shale boom in the US may experience another period of explosive growth if the oil price remains high and steady, but existing infrastructure and processes may struggle to keep up with new growth. By leveraging ND water data, companies can update their water strategy and identify key prospects for new developments or opportunities for partnerships. ND may be cold, but it doesn’t need to be out in the cold when it comes to developing data driven water strategy.
EMPOWERING SMART WATER MANAGEMENT
B3 Insight is building the definitive source for water data. We empower smart water management with data-driven intelligence for responsible and profitable decisions about water resources. Whatever your needs, B3 Insight’s OilfieldH2O can positively impact your water management and drilling completions – contact us at [email protected] or 720-664-8517 to learn more.
NOTES
- Energy Information Administration. 2022. Petroleum Production. https://www.eia.gov/petroleum/production/.